
If you want to become a successful investor, you need to know how to understand a company’s financial statements. Conducting financial statement analysis is crucial in making or breaking an investment opportunity. Below we will cover financial statement basics, financial statement analysis and key financial ratios. Let’s get into how to read financial statements.
6 No-Brainer Ways on How to Read Financial Statements
For a speculative investment approach like day trading of stocks, options, and futures, it might not be necessary to have a look at financial statements. But if you’re going to invest in a specific company with a long-term perspective, then your first point of reference will be its financial statements.
Through financial statement analysis, you can find undervalued stocks in a straightforward manner.
This, therefore, means that understanding what all the figures in financial statements indicate is quite critical. However, reading and interpreting financial statements can take a toll on anyone – and sometimes, even some accountants get it wrong when it comes to this.
My name is Alexander, founder of daytradingz.com. In this post, you will be shown exactly how to correctly read and understand a company’s financials to enable you to make wiser investments choices.
The article may not teach you how to become an accountant, but you’ll surely learn how to have an expert’s view of the financial statements.
If you want to invest your money effectively, you’ll need to know how to read financial statements. Millionaire Mob wrote a dividend investing book to help people get started investing.
The book is titled Dividend Investing Your Way to Financial Freedom and features a number of resources to help you invest for financial freedom, including:
- Improve your portfolio returns
- Understand the pros and cons of a dividend investing approach
- Develop and craft your own dividend investing strategy
- Build wealth through a long-term compound interest plan
If you want a sample of the book, you can download it here.
A tool like Personal Capital can help you manage your investment exposure for free.
Why Financial Statement Analysis is Important
Financial statement analysis is crucial because it will tell you information about a potential investment not otherwise seen through valuation/pricing, qualitative analysis, and more. A company might have an outstanding product with great growth, but have completed mismanaged their financial standing.
With the right financial statement analysis, you can uncover opportunities that might have room for improvement in a company’s financials not inherently priced into the valuation.
A good example was with Apple during their cash hoarding phase, a few investors noticed that they could optimize the capital structure by using leverage to repurchase shares and pay a dividend.
Apple had so much cash that they could use leverage at extremely low rates to repurchase state that had a return on equity of greater than 15%. It’s simple math.
If you are going to be an equity investor, you are lowest on the capital stack. Thus, it’s even more important to analyze a company’s financial statements to understand the viability of the company as a going concern.
You need to understand how to read financial statements if you investing in stocks, building a dividend portfolio, real estate, debt, etc. Every investment requires some level of financial statement scrutiny.
Getting started with investing is easy nowadays, these platforms will give you free stock simply by signing up.
How to Analyze Financial Statements
Two key financial statements are crucial towards understanding the financial position of any company. They include:
- Income Statement
- Balance Sheet
Let’s see how you can go about analyzing each of these separately.
How to Analyze an Income Statement
An Income Statement is a financial document containing the Revenue, Expenses, and the Net Profit of a company during a certain of time, mostly one year.
We may not cover every tiny detail of an income statement, but we’ll certainly cover some of the most important aspects using some ratios and relationships.
1. Net Profit Margin
This is the Net Income after tax divided by Total Gross Revenue.
For instance, if a company’s income statement contains an after-tax income of $100,000 and a gross revenue of $1,000,000, then you’ll analyze its Net Profit Margin by doing the following:
Net Profit Margin = $(100,000/1,000,000) which yields a Net Profit Margin of 10%.
Do this for similar companies in the industry to see how high or low a company’s net profit margins are. A higher ratio than its competitors means the company is doing well and the vice versa.
2. Earnings Per Share (EPS)
The EPS is a figure that shows the portion of the profit of a company that is allocated to each share traded on an exchange. It is calculated by dividing the net after-tax income by the number of outstanding shares, and the resultant figure shows a company’s ability to distribute profits to its shareholders.
Consider an example of these three company whose 2017 performance was as follows:
| Company | Net Earnings | No of Outstanding Shares | Earnings per Share (Net Earnings/Outstanding Number of Shares) |
| McDonalds | $5.19 billion | 807.4 million | 6.4 |
| $15.9 billion | 2.9 billion | 5.5 | |
| Amazon | $3.03 billion | 480 million | 6.3 |

MarketWatch Earnings Per Share
If you were presented with the statements of these three companies for analysis, you can now clearly see that McDonald’s offered the best Earnings per Share in 2017 compared to Facebook and Amazon. This meant that McDonald’s had more sufficient income to pay dividends to its shareholders.
► Consider using stock analysis tools or a stock screener like the following:
- FINVIZ,
- TradingView,
- MarketWatch and
- Finbox.io with free functionalities to find the best companies listed at NYSE and NASDAQ based on their earnings per share growth.
FINVIZ has a great, easy to use screener that is completely free to use. Here’s a guide on how to use FINVIZ.
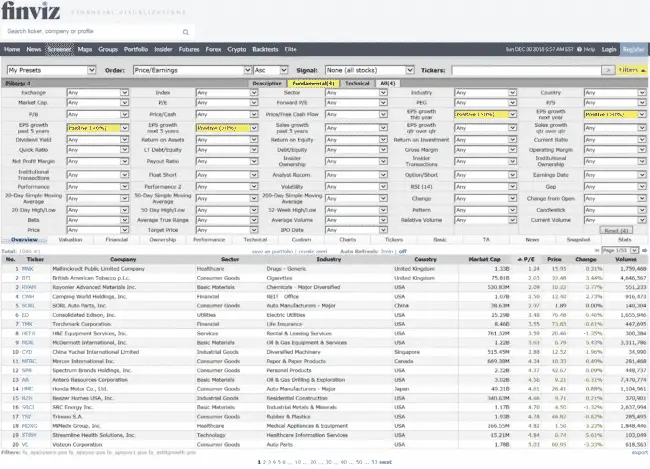
FINVIZ Stock Screener Dashboard
Alternatively, you can use a tool like Motley Fool Stock Advisor to have new investment ideas sent to you. This can be a great way to get idea generation flowing for your investing goals. I like working smarter not harder.
Here’s my Motley Fool Stock Advisor review if you want to see if it’s worth the price.
3. Return on Equity (ROE)
Return on Equity reflects the amount of net income as a percentage of a shareholder’s equity. This metric is also known as the Return on Net Worth and is expressed as a percentage as follows:
ROE = Net Income/Shareholders Equity
If a company reports a Net Income (Net Profit) of $100, 000 and an average shareholder equity of $1,000,000, this means that the company’s Return on Equity is 10% i.e. (100,000/1,000,000).
If you compare this to other companies in the same industry, the highest of them all reflects the company that is putting its assets to better use and thus, the best performing.
In the next section, you’ll be shown how to analyze some vital items in the balance sheet.
How to Analyze a Balance Sheet
A Balance Sheet or a Statement of Financial Position is a document that shows the assets, liabilities, and the equity of a company.
Below are some of the metrics you’ll need to use to help you understand a company’s financials.
4. Quick Ratio
A company should be able to come up with cash as and when required to fulfill its obligations to avoid penalties, fines, or suits. It is therefore important for you to evaluate the ability of a company to come up with liquid cash using the Quick Ratio.
The ratio also speaks volumes about how a company manages its cash.
It is calculated by taking the Current Assets less Inventory, then dividing the resultant figure by the Current Liabilities.
Consider this example of two companies operating in the same industry:
Company 1: Microsoft Corporation’s part Balance Sheet showing Current Assets and Current Liabilities.
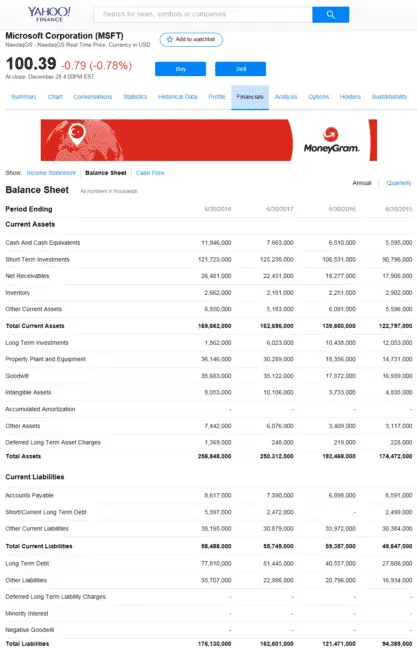
Yahoo! Finance Microsoft Financial Statements
Company 2: Apple Incorporation’s part balance sheet also showing Current Assets and Current Liabilities.
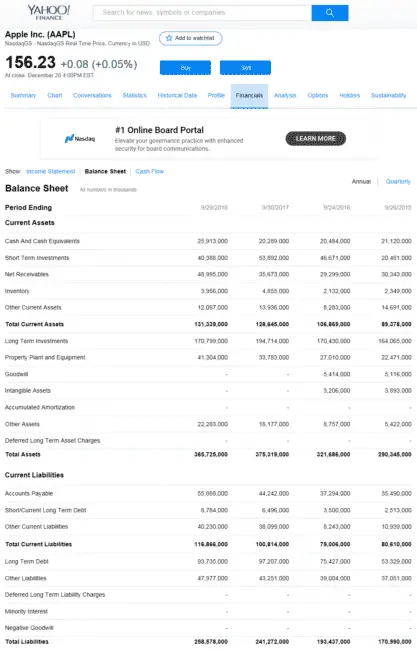
Yahoo! Finance Apple Financial Statements
Source of images: https://yhoo.it/1jUfBeX
From the part balance sheets, we can easily compare the performance of the two companies in terms of the ability to raise liquid money within short notice as follows:
Quick Ratio is calculated using the formula: (Current Assets – Inventory)/Current Liabilities
Microsoft’s Quick Ratio in the second quarter of the year 2017 = $ (162,696,000 – 2,182,000)/55,745,000 which comes to 2.88.
Even before we analyze the next company, I need to mention that a ratio of 1 and above is an acceptable industry standard.
Apple’s Quick Ratio in the third quarter of 2017 = $ (128,645,000 – 4,855,000)/100,814,000 which yields 1.23.
The two ratios, therefore, mean that Microsoft was in a better position to raise liquid cash in the second quarter of 2017 as compared to Apple in the third quarter of the same year.
5. Account Receivables Turnover (In Days)
A decent number of big corporations went into receivership simply because they accumulated more debts that their working capital could sustain.
This typically leads to a cash crunch which paralyzes the operations of a company.
Therefore, the Accounts Receivables ratio in days is essential towards evaluating the ability of a company to collect their debts in a timely manner.
The ratio is obtained by dividing the standard number of days in a year (365 or 360) by the ratio from the formula:
Credit Sales/Average Accounts Receivable,
In full, this is the formula: 365 OR 360/(Credit Sales/Average Accounts Receivables)
To make this clearer, consider a company with sales amounting to $1,000,000 out of which $100,000 are cash sales. In addition, the company had an opening receivables balance of $50,000 in January and $100,000 in December.
To obtain the Accounts Receivable Turnover ratio in days, you’ll need to do the following:
Ratio = $ (1,000,000 – 100,000) / (50,000+100,000/2)
The number of days within a year will then be divided by the resultant figure, in this case, 12, to obtain the required ratio as seen below:
Ratio = (365/12) which is approximately 30. This means that it takes an average customer 30 days to pay debts owed to the company.
You can compare this ratio to other industry players to gauge and see how effective a company’s debt collection department is. The lesser the number of all days, the more unlikely a company will encounter a cash crunch.
6. Book Value (Net Tangible Assets)
This metric is used to measure how a company earns from its investment in physical assets. It is evaluated by taking a company’s Total Assets less Intangible Assets such as Goodwill – the difference represents a company’s net physical assets.
An enterprise that makes a profit of $10 million using $20 million worth of net assets is definitely better than one that generates $10 million in profits using $40 million in net assets.
There you have it!
Like I mentioned earlier on in this article, it may not be possible to highlight every detail of a company’s financials. However, the above is meant to help get an overview of how to read and understand financial statements.
Here are several other financial ratios to consider during the financial statement analysis process.
Conclusion on Financial Statement Analysis
Of course, investing is more than just reading and correctly interpreting financial figures. And there’s no doubt that financial statements are a key source of information regarding the financial health of a company, but they are not a means to an end.
It is essential for you to stay informed about other happenings around the financial space to help you make informed decisions about conclusions drawn from a company’s financials.
Other things you need to consider include business takeovers, tech advancements, political events, economic trends, among other things.
The best thing about learning how to read financial statements is perhaps the fact that you don’t necessarily need to pay a financial guru or an accountant to interpret for you the financial figures.
This will save money while keeping you in charge of your investment decisions and avoid myths of investing.
The downside, however, is that when you read financial statements, you’ll need to keep in mind that these accounting reports are somewhat tentative and conditional.
Accountants make a lot of estimates and projections when it comes to revenue, other income figure, expenses and losses.
At some point, soft numbers can be mixed in with hard numbers in the statements. To cut the long story short, financial statements can be quite iffy; and it can be challenging to get around this accounting limitation.
Do you understand how to read financial statements now? Let us know in the comments below. We’d love to hear from you!
Other Related Investing Money Resources:
- Use these smart investment techniques to turnaround your investment portfolio
- Our resources on how to invest money to ensure success
- Our free dividend calculator to see what it will take to live off dividends
Subscribe to the Millionaire Mob early retirement blog newsletter to find the best travel hacking tips, dividend growth investing, passive income ideas and more. Achieve the financially free lifestyle you’ve always wanted.
Follow me on Facebook, Twitter and Instagram.
The post 6 No-Brainer Ways on How to Read Financial Statements appeared first on Millionaire Mob.
from Millionaire Mob http://bit.ly/2D5aZ6h
via IFTTT
Thanks
ReplyDeleteNet Profit Margin